Medieval ideas about lands and peoples were very different from ours. So when we look at their maps, questions arise:

- Why do medieval maps show Paradise?
- What are we to make of the dog-headed monsters who live at the edges of the earth?
- Why did medieval scholars use geographical information that was centuries old?
In order to answer these questions, we need to understand the cultural context of medieval geography.
Not Just Road Maps
Medieval geographical descriptions and maps did not serve just to orient people in the world around them. Unlike modern maps they did not show only physical space. We value modern maps for accuracy and often use them to give us directions.
Medieval people expected their maps to include not only information about the physical world, but also about religion and history. So it should not be surprising that medieval maps look different from ours: they are not drawn to scale, and they do not have latitude and longitude lines.
It took a long time for medieval mapmaking and geography to change. Even after more modern-looking maps began to appear in the fifteenth and sixteenth centuries, people still continued to copy and study older medieval maps.
There were many kinds of maps in the Middle Ages. Maps could be detailed or schematic. They had different shapes and focused on different things. Some showed the whole world, some presented specific regions, some emphasized roads, some climatic zones. Maps were meant for broad education in both secular and religious subjects. They also reinforced ideology and conveyed political ideas.
Following classical Greek and Roman ideas, most scholars in the Middle Ages believed that the Earth was spherical and that it had five climatic zones. The two polar zones and the equatorial zone in the middle were considered uninhabitable because of their extreme cold or heat, so people could live only in the two temperate zones in between. Classical and medieval geography focused on the northern zone as the location of the oikumene, the inhabited earth. Some scholars allowed that life was possible in the southern temperate band as well, but no one could cross the torrid equatorial zone to get there. Zonal maps ![]() , which often appear in medieval manuscripts, were meant to illustrate the ideas of the spherical earth and climatic zones so that students and scholars might better understand them.
, which often appear in medieval manuscripts, were meant to illustrate the ideas of the spherical earth and climatic zones so that students and scholars might better understand them.
The Ebstorf Map
The Ebstorf Map was a richly detailed map not focused on climatic zones. It was the largest of the known medieval mappaemundi, measuring twelve feet in diameter. The map was destroyed during World War II, but detailed copies made in the 1950s allow us to appreciate the wealth of knowledge and the care which went into its making. The map has around 1,200 legends, and it includes depictions of:
- seas
- rivers
- mountains
- cities
- monasteries
- peoples
- animals.
The map was found in the convent of Ebstorf in Germany. Many scholars believe the nuns of Ebstorf may have produced the map between 1230 and 1250. Roughly contemporary with Bartholomews encyclopedia, the Ebstorf Map is similar to written encyclopedias in that it is comprehensive, but it presents knowledge about the world in pictorial form.
Like Bartholomews encyclopedia, the map draws on both classical and Christian traditions of describing the earth. According to the classical tradition, the inhabited land surface was divided into three continents: Europe, Africa, and Asia, all surrounded by the ocean. Bartholomew wrote about them in Book 15 of his encyclopedia:
Moreover as Isidore [of Seville] notes...the world is divided in three parts. One part is called Asia, another is Europe, and the third is Africa. [Orbis autem, ut dicit Isidorus .... tripartite est divisus. Nam una pars Asia, alia Europa, tertia Affrica appellatur.]
He also added traditional Christian lore, explaining that the division of the earth into three continents goes back to the time after the Great Flood. The Bible tells us that when Noah distributed the earth among his three sons, Shem received Asia, Japhet Europe, and Ham Africa. These views are best illustrated by schematic drawings, so called T-O maps ![]() , many of which survive in medieval manuscripts. The Ebstorf Map, although much more detailed, is organized along the same scheme. There is also a small schematic drawing in the right upper corner of the map showing the location of the three continents.
, many of which survive in medieval manuscripts. The Ebstorf Map, although much more detailed, is organized along the same scheme. There is also a small schematic drawing in the right upper corner of the map showing the location of the three continents.
Mapping our Relationship to God
Christian scholars in the Middle Ages saw studies of the physical world, including the earth and people who live on it, as a way to understand God. The Ebstorf Map shows the world in its relationship to God, presenting the earth as the body of Christ. Christs head marks the East at the top of the map, and his hands and feet mark the rest of the cardinal directions.

Christ's head, in top center of the map
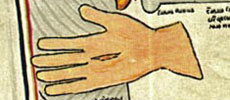
Christ's hand, on the far right middle of the map
Christ's foot, at the bottom of the map
Paradise is located in the east, close to the top of the map, next to Christ's head.
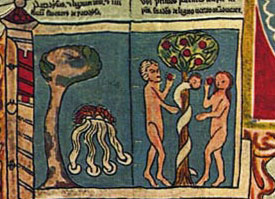
Following the Bible, the mapmakers depicted Adam and Eve standing at the Tree of Life and looking at the snake while holding apples in their hands. The legend on the map explains the picture and summarizes the biblical account:
Paradise, and the tree of life, and the four rivers flowing from Paradise, where the snake deceived our forebears and persuaded them to eat from the forbidden tree. [Paradisus et lignum vitae et quattuor flumina fluentes de Paradiso, ubi primos parentes decipit serpens suadens de ligno vetito manducare.]
Bartholomew, too, locates Paradise among the provinces of the earth, in the East, and talks about the rivers that flow from Paradise: the Tigris and the Euphrates in Mesopotamia (modern Iraq), and the Geon or the Nile that flows through Egypt [15.112].
Jerusalem is located at the center of the map, with a depiction of Christ rising from his tomb.
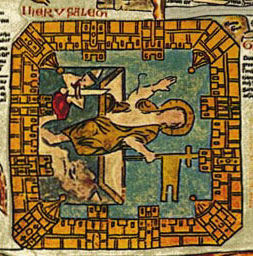
Jerusalem often appeared on mappaemundi and in geographical descriptions as the center of the earth. Significant for Christians as the place of Christs death and resurrection, Jerusalem in the Middle Ages was a destination for pilgrims and warriors. The Crusades that took place from 1099-1291, did not succeed in holding conquered territories. But direct knowledge gained during these expeditions eventually contributed to a greater awareness of the world. So, diagrams of the layout of Jerusalem ![]() become more detailed as they appear on Crusader maps from the twelfth century on.
become more detailed as they appear on Crusader maps from the twelfth century on.
Barbarian Climates and Countries
Geographical texts and maps usually included information about people, animals, and plants. According to the Classical tradition, location and climate influenced the character and appearance of the inhabitants and the nature of their societies. A temperate climate was the best, producing the most balanced and civilized people. "Barbarians" lived in less fortunate places, where too much heat made people lazy and crafty and too much cold made them warlike and stupid.
Similarly, writers in different times presented the location and boundaries of the civilized world in different ways. Greeks and Romans meant that the civilization was that around the Mediterranean Sea. In the Middle Ages it shifted toward the northern European regions. The location of the barbarians changed accordingly, but the main idea remained the same.
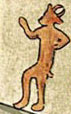
Barbarians were described as people with weird and sometimes disgusting customs who wore funny dress or none at all and spoke incomprehensible languages. The farther from civilization and the closer to the edges of the earth, the less human and more monstrous became the people, and the more wondrous and strange became animals and plants.
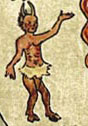
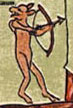
Bartholomew follows this ancient tradition when he talks about dog-headed people who live in India and about the people in Ethiopia who live in caves and eat snakes. The creators of the Ebstorf Map also have images of strange peoples, including:
- people who lack noses, tongues, or ears
- people who have four mouths
- dog-headed people, and so on.
Illustrating the Present and the Past Simultaneously
Large mappaemundi presented the world not at one fixed moment in time but rather throughout classical and Christian history. The Ebstorf Map depicts or mentions places and events significant both in the present and the past and known from personal experience, stories, and myths. The map shows the city of Troy, famous from medieval retellings of Homers story about the Trojan War.
We can also see places associated with Alexander the Great, the king of Macedonia who in the fourth century BCE conquered almost the entire known world.
An earlier Christian legend connected Alexander to the biblical story of Gog and Magog, the two apocalyptic peoples that were to bring devastation in the end of times. According to the legend, Alexander the Great enclosed these dangerous nations behind a wall. The Ebstorf Map shows the wall and the people within it and explains:
Here Alexander enclosed two impure nations, Gog and Magog, who will be the servants of the Antichrist. They eat human flesh and drink blood. [Hic inclusit Alexander duas gentes immundas Gog et Magog, quas comites habebit Antichristus. Hii humanis carnibus vescuntur et sanguinem bibunt.]
Throughout the Middle Ages, particularly feared peoples were identified as Gog and Magog. On the Ebstorf Map, we find the Turks cast in this role.
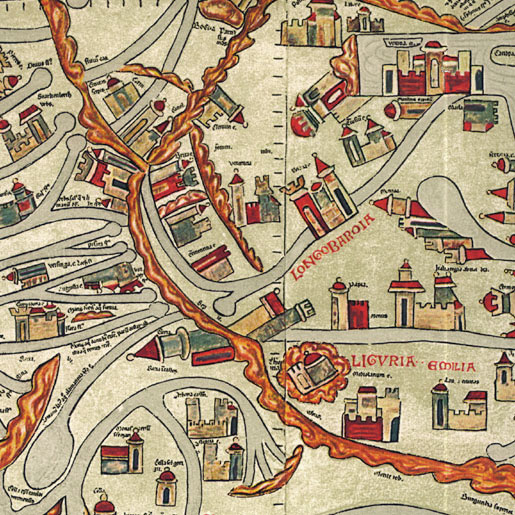
Powerful People Close to Home in the Imperial Past
The Ebstorf Map also emphasizes important places in contemporary life, such as the location of powerful bishops. The regions that mapmakers knew well are depicted in greater detail, especially Lower Saxony in Germany, where the convent of Ebstorf is located. The mapmakers took care to show relatively minor rivers. Its of the residences of local rulers are as large as the picture of Rome. They also put Ebstorf on the map, although the nunnery was neither the largest nor the most important at that time.
Similarly, Bartholomew added contemporary names of cities and regions he was familiar with himself, such as Anjou in France or Bohemia (the modern Czech Republic), when describing Europe. But he relied on traditional sources when he talked about most other places in the world, especially the faraway lands of Asia and Africa.
Maps and texts could also be used to reinforce imperial ideology. Medieval European rulers turned to the Roman Empire for models of imperial power or justification of political claims. Medieval scholars and kings also believed that it was Roman emperors who ordered the first maps of the world to be made. The tradition went back to the ancient Romans themselves, who connected military conquests with geography: only when conquered could the world be described and put in order.
The Ebstorf Map reflects this belief and names Julius Caesar as the creator of the first world map. Julius Caesar lived in the first century BCE and was famous both in Antiquity and in the Middle Ages for his military successes and political power. The inscription in the right upper corner of the Ebstorf Map tells us that Julius Caesar sent envoys to collect information about the whole earth so that its provinces, islands, cities and so on might be presented on a map.
Other mappaemundi and texts also use this tradition, sometimes naming Augustus rather than Julius Caesar as the author of the first mapmaking project. Augustus was the first Roman emperor who ruled from 27 BCE-14 CE. Christian writers considered it significant that Christ was born during the reign of Augustus, a time marked by peace and prosperity. [Picture from the Hereford Map] This medieval image shows a very direct connection between maps and power ![]() .
.
Still Teaching Today
Just as our maps are part and product of our life, medieval maps and texts were created in response to the needs of contemporary life and culture. Representations of lands and peoples reflected ideas not only about geography, but also about history, religion, and politics. So today medieval maps help us better understand the medieval world.